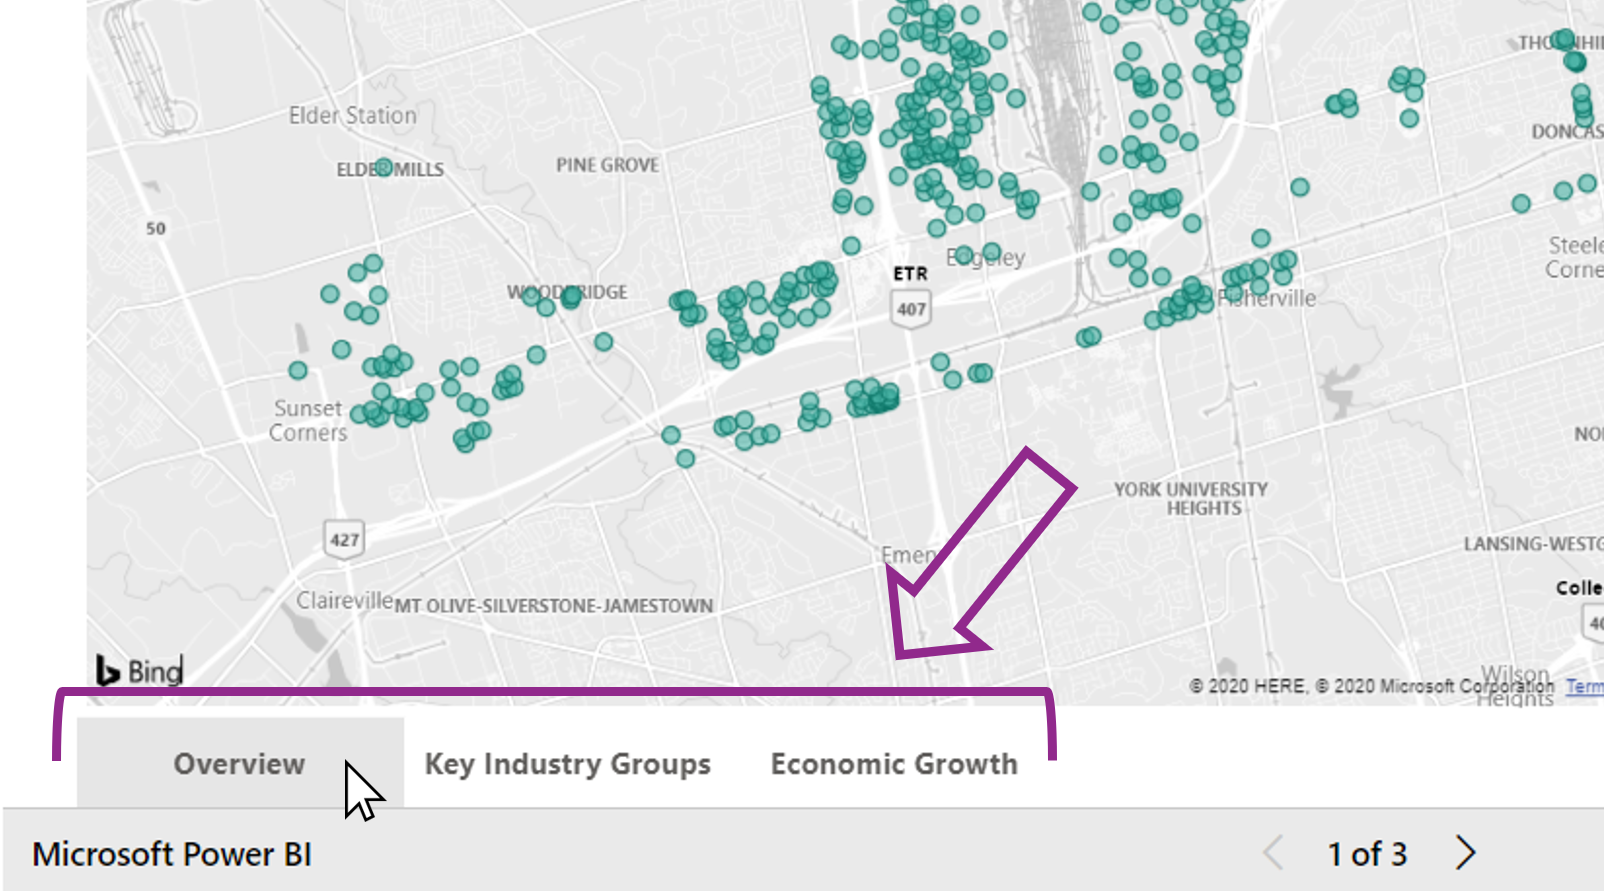
Navigate with Tabs
Each dashboard has multiple tabs with different topics.
The tabs are visible in the bottom left corner of the dashboard. Click on a tab to jump to that topic.
We are using Power BI to display large amounts of data. To get the most out of it, here are some tips…
Each dashboard has multiple tabs with different topics.
The tabs are visible in the bottom left corner of the dashboard. Click on a tab to jump to that topic.
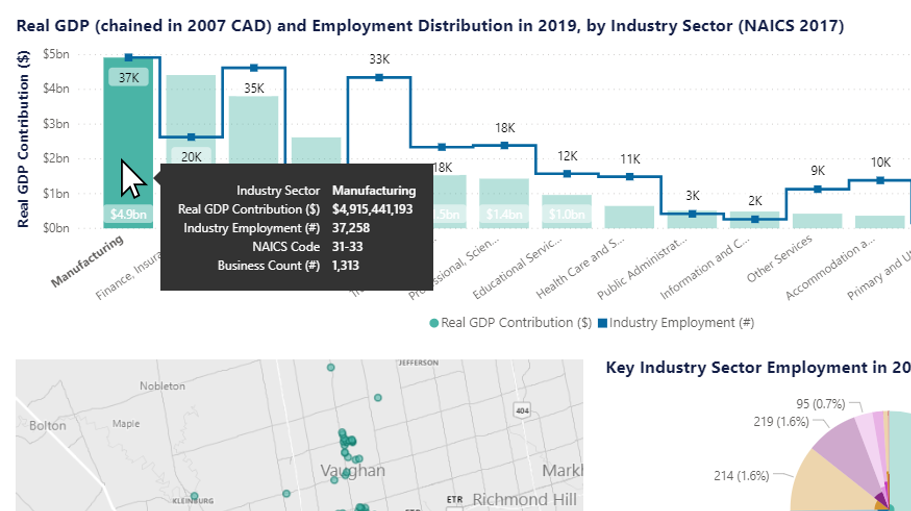
Click on individual bars, pie slices, etc to filter. CTRL + click to select multiple.
Click on background to exit.
Right click on background to show data as a table.
Use your mouse scroll wheel to zoom in and out.
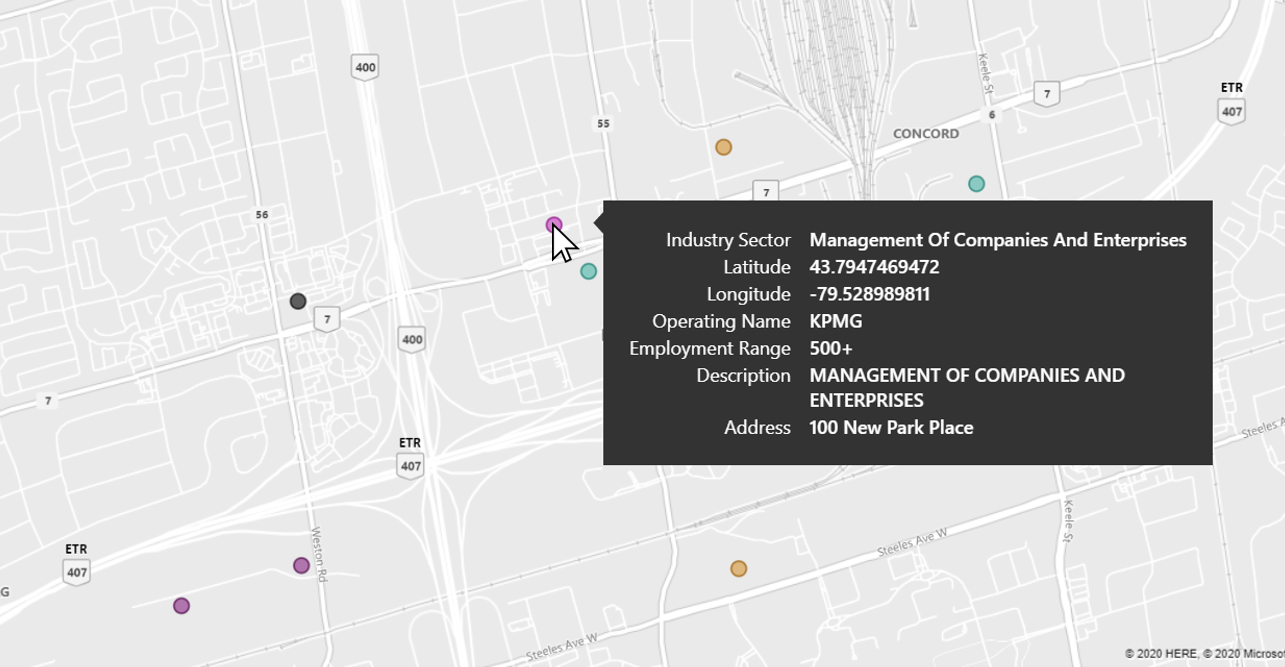
Hover over a data point to show more information
Information on Vaughan’s economy including real gross domestic product (GDP), employment, key sectors, location quotient, and major employers.
This report is best viewed on a laptop computer or bigger
Information on demographics, immigration, population growth, language, education, income and dwellings.
This report is best viewed on a laptop computer or bigger
Information on construction investments including new construction.
This report is best viewed on a laptop computer or bigger