For updates on how the U.S tariffs impact the Vaughan business community, visit vaughanbusiness.ca/tariffs.
PowerBI Quick Start Guide
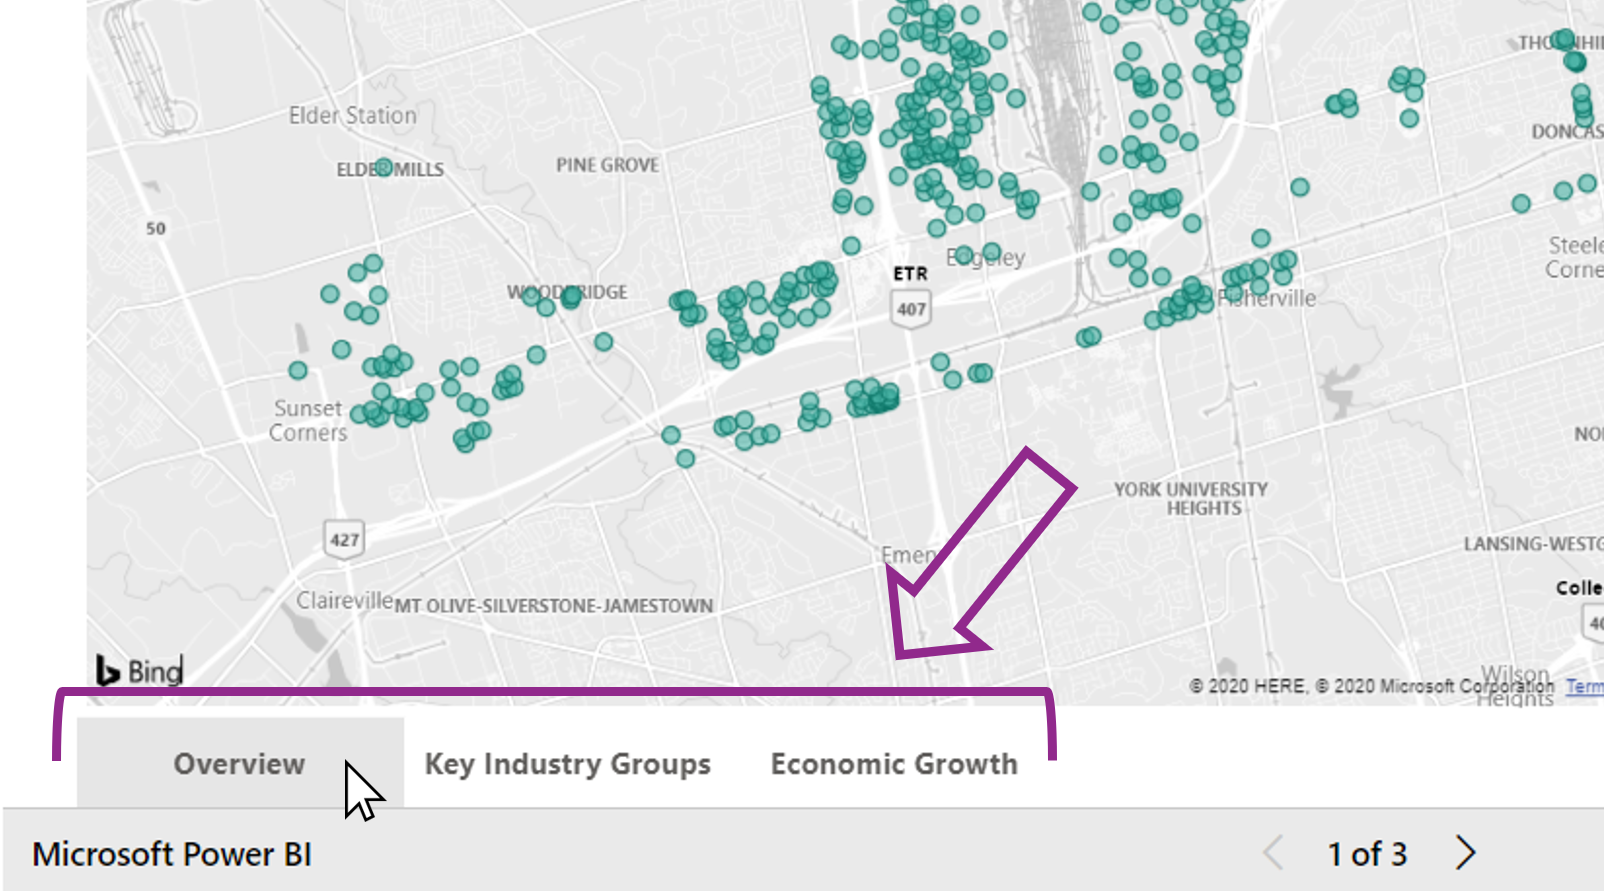
Navigate with Tabs
Each dashboard has multiple tabs with different topics.
The tabs are visible in the bottom left corner of the dashboard. Click on a tab to jump to that topic.
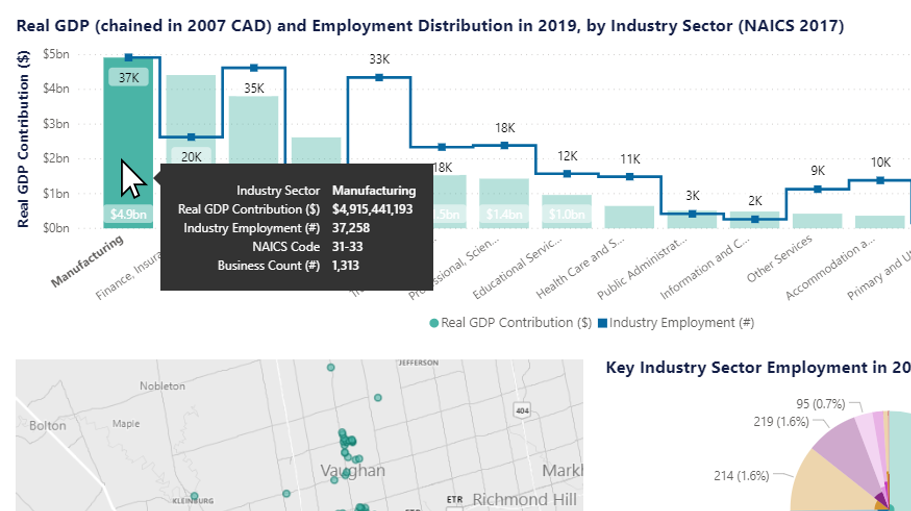
Graphs and Charts
Click on individual bars, pie slices, etc to filter. CTRL + click to select multiple.
Click on background to exit.
Right click on background to show data as a table.
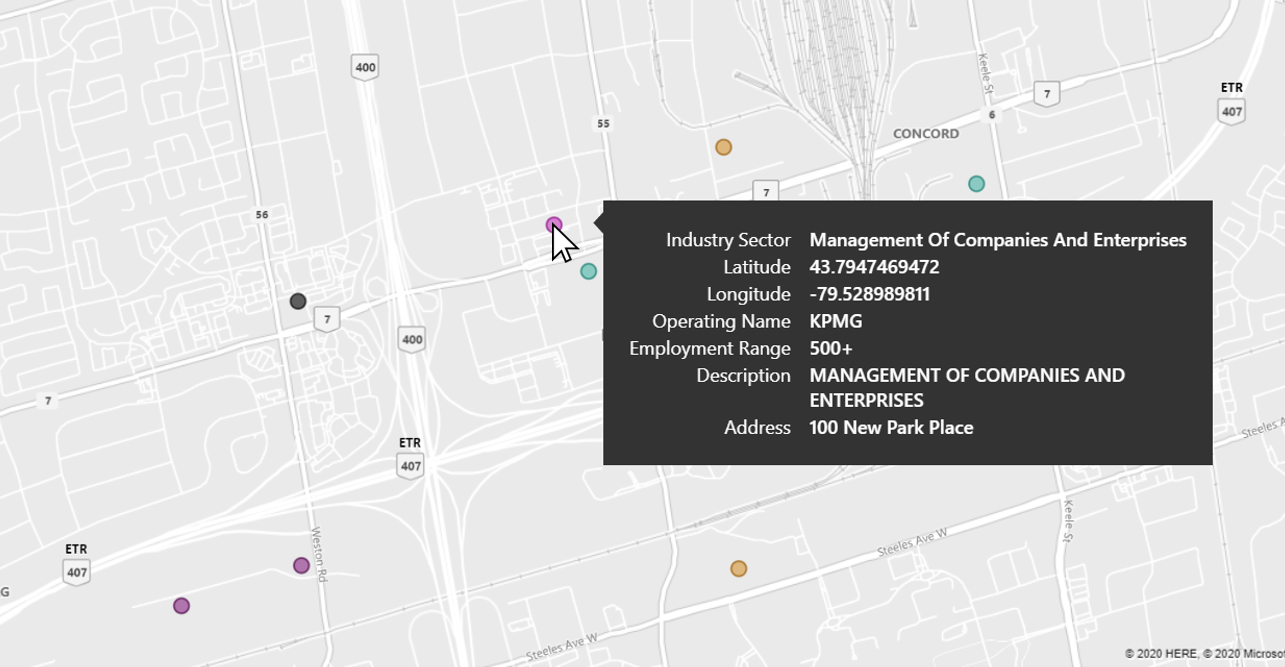
Maps
Use your mouse scroll wheel to zoom in and out.
Hover over a data point to show more information